Debugging DNS response times with tshark
One of my holiday projects was to redo and optimize part of my home network. One of my homelab servers failed in November. I had only thrown the replacement in the rack to get going, but some cleanup was needed. In addition, a lot of other "layer 1" issues had to be fixed by re-crimping some network drops and doing general network hygiene. The dust buny kind hygiene, not so much the critical controls type. After all, I don't want things to overheat, and it is nice to see all network links syncing properly.
But aside from the obvious issues, there was a more subtle and rather annoying one: Sometimes a website would take a long time to load. This was, in particular, the first time of the day I loaded the particular side, and it happened across a wide range of sites (pretty much any site). I ruled out ad filters and other security tools by temporarily disabling them. So I figured, it may be time to blame DNS...
Luckily, tshark has some great tools to inspect and summarize DNS. To get started, I collected about an hour of DNS traffic on my firewall, and next, loaded it into tshark.
I started with the default "DNS statistics summary":
tshark -z dns,tree -nr dns.pcap
The output is rather verbose, so I am just highlighting some parts here

I got about the same number of queries and responses, so that part looked ok. It does not look like anything was completely off/wrong. Next, tshark summarized the DNS query types:

The first test I ran (not shown above) had a huge number of PTR record lookups. It turns out that this was my NTP server. Last year, I added one of my GPS-synced NTP servers to pool.ntp.org. It is now getting quite a bit of traffic. For whatever reason, it was configured to do reverse lookups on all connections. I do not know if I enabled this, or if this was the default (change control is for people who don't enjoy troubleshooting with tshark). The screenshot above is from after I had this feature turned off and shows a more normal distribution. tshark produces a similar breakdown for answers. The SOA, IXFR, and AXFR queries are due to some internal zones I use that are dynamically updated. My recursive nameserver hs DNSSEC validation enabled, which explains the DS, DNSKEY, and NSEC/NSEC3 queries.
From a performance point of view, the last few lines of the report are most interesting:
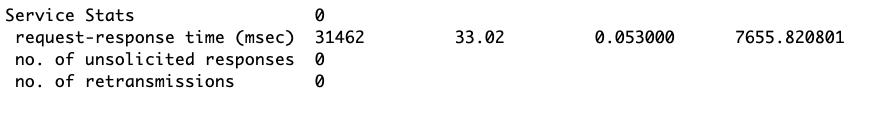
The average response time was 33 ms, which isn't too bad. But the maximum response time was almost 8 seconds. So let's try and dive into that in more detail:
tshark calculates the response time for each DNS response, and you can filter for it, or display it, using the "dns.time" field. I went for this approach:
tshark -nr dns.pcap -Y 'dns.flags.response==1' -T fields -e dns.time -e dns.qry.name -e ip.src | sort -n
This returns the response time, the query name, and the source IP, to identify what is causing these long response times. I sorted the output by response time. The last few lines of the output (every response exceeding 7 seconds):
7.221731000 firmware.zwave-js.io 1.1.1.1
7.222681000 isc.sans.edu 75.75.75.75
7.224087000 firmware.zwave-js.io 9.9.9.9
7.225434000 firmware.zwave-js.io 75.75.75.75
7.229738000 firmware.zwave-js.io 8.8.8.8
7.655821000 ywab.reader.qq.com 8.8.8.8
The "firmware" hostname is likely related to some IoT devices, and I doubt this affects my laptop's browsing experience. qq.com is not used by me but by other family members. So that leaves isc.sans.edu (which also had a 6-second response not shown here).
Next, I checked if all the forwarding servers I am using behaved the same. I am using 1.1.1.1, 8.8.8.8, 9.9.9.9, and 75.75.75.75 (Comcast, my ISP).
All four behaved very similarly on average:
| Mean | Median | Std Variance | |
| 1.1.1.1 | 0.0350 | 0.0196 | 0.0381 |
| 8.8.8.8 | 0.0372 | 0.0200 | 0.0412 |
| 9.9.9.9 | 0.0366 | 0.0198 | 0.0365 |
| 75.75.75.75 | 0.0348 | 0.0200 | 0.0361 |
If anything, I was surprised how close the results were to each other. I am using Comcast as an ISP, and I believe DNS servers like 1.1.1.1/8.8.8.8/9.9.9.9 use likely the same anycast infrastructure used by Comcast's own servers (75.75.75.75).
Everything worth doing is also worth overdoing, so I created a quick plot of the data via gnuplot, and again, the four servers' response time is pretty much identical:
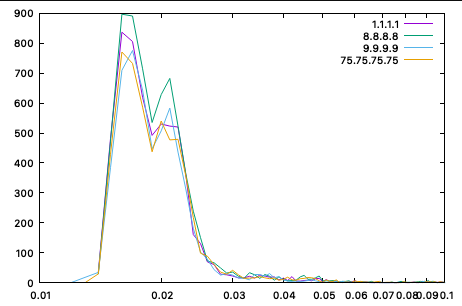
(This was close enough for me to double-check the filters.)
So what is the result? For now, the main outcome was to avoid the PTR queries from the NTP server (again, the data above was collected after). About half the queries were PTR queries, and PTR queries often fail and result in timeouts. But I am a bit in the denial phase as far as blaming DNS goes. I will let you know if I find something else.
--
Johannes B. Ullrich, Ph.D. , Dean of Research, SANS.edu
Twitter|


Comments