Suspicious Domains Tracking Dashboard
Domain names remain a gold mine to investigate security incidents or to prevent some malicious activity to occur on your network (example by using a DNS firewall). The ISC has also a page[1] dedicated to domain names. But how can we detect potentially malicious DNS activity if domains are not (yet) present in a blocklist? The typical case is DGA’s of Domain Generation Algorithm[2] used by some malware families.
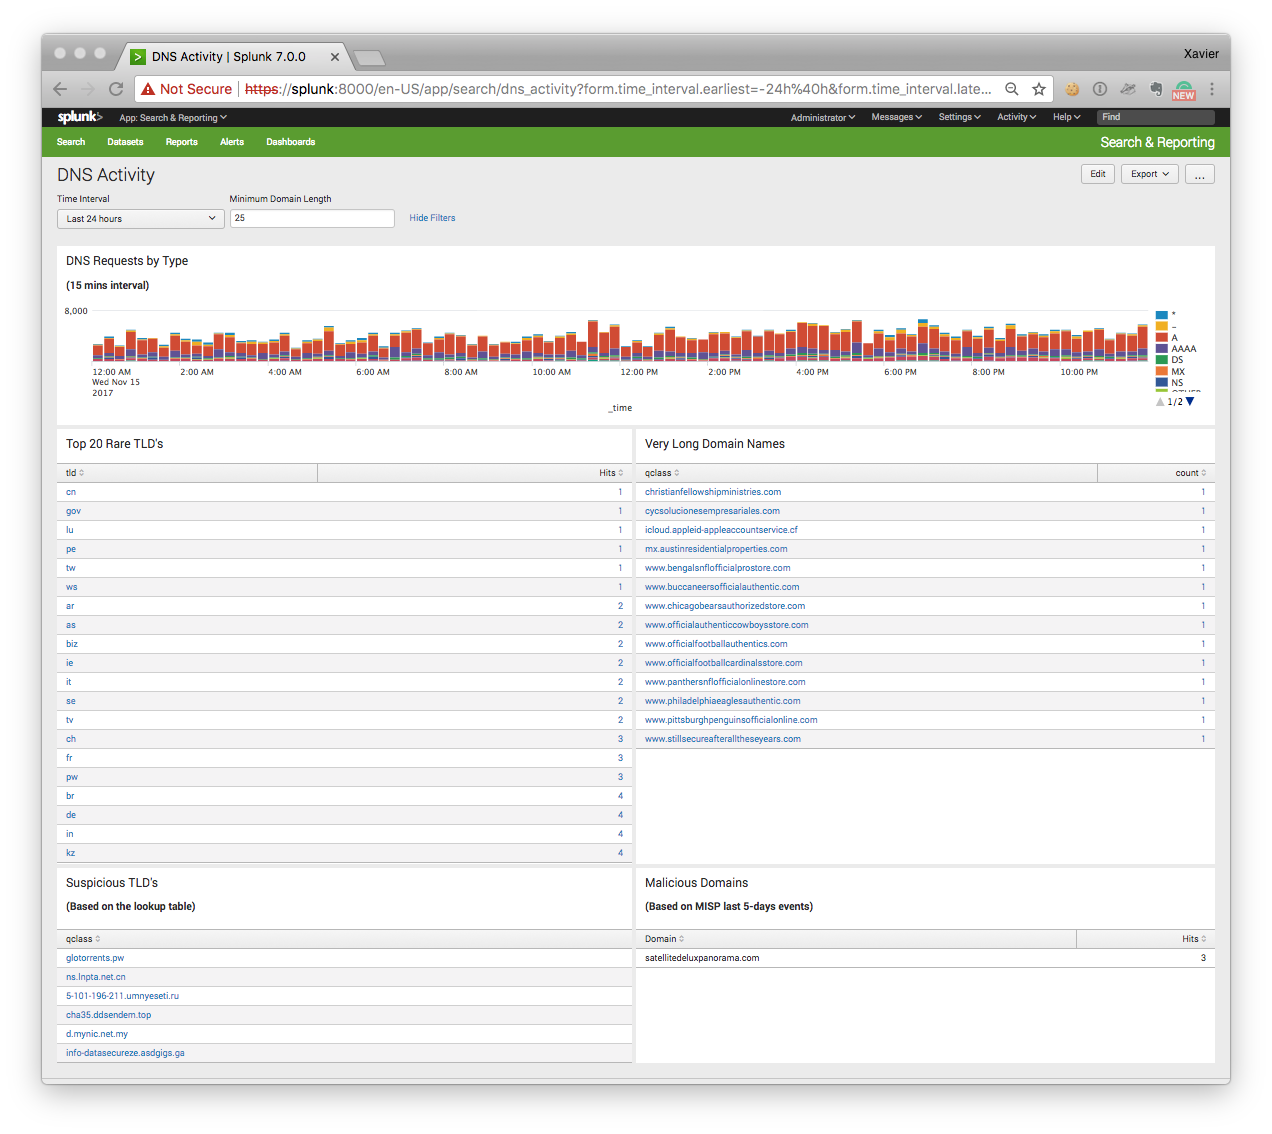
I have a dashboard that helps me to keep track on the DNS activity on networks under my control. Here is a screenshot:

The dashboard contains the following searches:
“DNS Requests by Type”
This timeline represents the DNS traffic based on the queries (“A”, “AAAA”, “NS”, etc). A peak of “TXT” queries may indicate some data ex-filtration or DNS tunnelling ongoing.
“Top 20 Rare TLD’s”
With the explosion of new TLD’s (Top Level Domains), we see that some of them are mainly used by bad guys. Usually, the domain registration process is easy (free) or registrars protect the domain owner’s privacy. TLD’s are extracted from the queries via a regex (the string after the last ‘.’ character). The top-20 is sorted by the number of occurrences found.
“Very Long Domain Names”
In this case, the string before the last dot is extracted and its size checked. DGA or kill switch domain use very long random strings (do you remember the Wannacry[3] case?
“Suspicious TLD’s”
This search returns DNS queries that use a “suspicious” TLD’s based on a blocklist that I maintain. Some examples:
.pw
.top
.ga
.cn
.ru
.co
.ml
“Malicious Domains”
This search returns DNS queries that are reported as valid IOC’s from my MISP[4] instance. To achieve this, I’m using the Splunk custom search command ‘getmispioc’[5]:
index=securityonion sourcetype=bro_dns
[|getmispioc last=5d type=domain
|rename value as qclass
|fields qclass
]
| rename qclass as Domain
| stats count as Hits by Domain
To generate this dashboard, I’m using bro_dns logs indexed in a Splunk instance but there is nothing specific to this setup and the dashboard can be easily deployed on another system like an ELK stack.
Happy hunting!
[1] https://isc.sans.edu/suspicious_domains.html
[2] https://en.wikipedia.org/wiki/Domain_generation_algorithm
[3] http://securityaffairs.co/wordpress/59072/cyber-crime/wannacry-ransomware-kill-switch.html
[4] http://misp-project.org/
[5] https://blog.rootshell.be/2017/10/31/splunk-custom-search-command-searching-misp-iocs/
Xavier Mertens (@xme)
ISC Handler - Freelance Security Consultant
PGP Key


Comments
expeditertruffleluxury.info
daresroutinebroadcast.info
fetalhydrantembroider.info
jumblejockeyhurler.info
The domains were all registered on the same date, 2017-08-26. The domain resolutions all point to IP blocks in Hurricane Electric data centers.
Anonymous
Nov 16th 2017
8 years ago
https://umbrella.cisco.com/blog/2015/03/05/opendns-unveils-nlprank-a-new-model-for-advanced-threat-detection/
AND
NCC DOMAIN CHECKER
https://labs.nccgroup.trust/typofinder/
Anonymous
Nov 16th 2017
8 years ago
I don't suppose you might be willing to share the XML source for that dashboard?
Cheers.
Anonymous
Nov 16th 2017
8 years ago
I would like to try and replicate this in my environment. Any chance that you would be willing to share your search and dashboard code?
Thanks!
Jon
Anonymous
Nov 16th 2017
8 years ago
Anonymous
Nov 16th 2017
8 years ago